“Gun violence in this country is an epidemic. Let me say it again: Gun violence in this country is an epidemic, and it’s an international embarrassment.” –Joe Biden 1
Tragically, each passing year in the United States brings an onslaught of high-profile – and low-profile – shootings. Thousands of Americans lose their lives each year to gun violence, and thousands more suffer injuries and further personal hardship. Often, these tragedies appear inexplicable, dumbfounding, and idiosyncratic. Nevertheless, finding actionable patterns and trends within gun violence data will allow policymakers to find focused solutions that are consistent with the statistical behaviors of shootings. Using a comprehensive record of gun violence data in the United States between 2013 and 2018, we plan to answer the following questions:
Each of these questions, which will be explored through techniques including logistic regression, sinusoidal (linear-based) regression, and Holt-Winters Seasonal Forecasting, have profound policy implications on allocation of gun violence-preventative resources, gun violence readiness, and legislation related to gun violence. Ultimately, we intend to provide a prescriptive analysis that includes recommendations for policymakers.
We base our analysis on the publicly-available data set “Gun Violence Data” by James Ko, published on Kaggle.com2. This set includes over 260,000 entries, each one representing an individual gun violence episode that occurred between January 1, 2013, and December 31, 2018. Every record has 29 corresponding fields, including date of incident, number of individuals injured, number of individuals killed, longitude & latitude, city or county, congressional district, and number of guns involved.
gunviolence.head()| incident_id | date | state | city_or_county | address | n_killed | n_injured | incident_url | source_url | incident_url_fields_missing | congressional_district | gun_stolen | gun_type | incident_characteristics | latitude | location_description | longitude | n_guns_involved | notes | participant_age | participant_age_group | participant_gender | participant_name | participant_relationship | participant_status | participant_type | sources | state_house_district | state_senate_district | |
|---|---|---|---|---|---|---|---|---|---|---|---|---|---|---|---|---|---|---|---|---|---|---|---|---|---|---|---|---|---|
| 0 | 461105 | 2013-01-01 | Pennsylvania | Mckeesport | 1506 Versailles Avenue and Coursin Street | 0 | 4 | http://www.gunviolencearchive.org/incident/461105 | http://www.post-gazette.com/local/south/2013/01/17/Man-arrested-in-New-Year-s-Eve-shooting-in-McKeesport/stories/201301170275 | False | 14 | nan | nan | Shot - Wounded/Injured | Mass Shooting (4+ victims injured or killed excluding the subject/suspect/perpetrator, one location) | Possession (gun(s) found during commission of other crimes) | Possession of gun by felon or prohibited person | 40.3467 | nan | -79.8559 | nan | Julian Sims under investigation: Four Shot and Injured | 0::20 | 0::Adult 18+ | 1::Adult 18+ | ||||
| 1 | 460726 | 2013-01-01 | California | Hawthorne | 13500 block of Cerise Avenue | 1 | 3 | http://www.gunviolencearchive.org/incident/460726 | http://www.dailybulletin.com/article/zz/20130105/NEWS/130109127 | False | 43 | nan | nan | Shot - Wounded/Injured | Shot - Dead (murder, accidental, suicide) | Mass Shooting (4+ victims injured or killed excluding the subject/suspect/perpetrator, one location) | Gang involvement | 33.909 | nan | -118.333 | nan | Four Shot; One Killed; Unidentified shooter in getaway car | 0::20 | 0::Adult 18+ | 1::Adult 18+ | ||||
| 2 | 478855 | 2013-01-01 | Ohio | Lorain | 1776 East 28th Street | 1 | 3 | http://www.gunviolencearchive.org/incident/478855 | http://chronicle.northcoastnow.com/2013/02/14/2-men-indicted-in-new-years-day-lorain-murder/ | False | 9 | 0::Unknown | 1::Unknown | 0::Unknown | 1::Unknown | Shot - Wounded/Injured | Shot - Dead (murder, accidental, suicide) | Shots Fired - No Injuries | Bar/club incident - in or around establishment | 41.4455 | Cotton Club | -82.1377 | 2 | nan | |||||
| 3 | 478925 | 2013-01-05 | Colorado | Aurora | 16000 block of East Ithaca Place | 4 | 0 | http://www.gunviolencearchive.org/incident/478925 | http://www.dailydemocrat.com/20130106/aurora-shootout-killer-was-frenetic-talented-neighbor-says | False | 6 | nan | nan | Shot - Dead (murder, accidental, suicide) | Officer Involved Incident | Officer Involved Shooting - subject/suspect/perpetrator killed | Drug involvement | Kidnapping/abductions/hostage | Under the influence of alcohol or drugs (only applies to the subject/suspect/perpetrator ) | 39.6518 | nan | -104.802 | nan | nan | |||||
| 4 | 478959 | 2013-01-07 | North Carolina | Greensboro | 307 Mourning Dove Terrace | 2 | 2 | http://www.gunviolencearchive.org/incident/478959 | http://www.journalnow.com/news/local/article_d4c723e8-5a0f-11e2-a1fa-0019bb30f31a.html | False | 6 | 0::Unknown | 1::Unknown | 0::Handgun | 1::Handgun | Shot - Wounded/Injured | Shot - Dead (murder, accidental, suicide) | Suicide^ | Murder/Suicide | Attempted Murder/Suicide (one variable unsuccessful) | Domestic Violence | 36.114 |
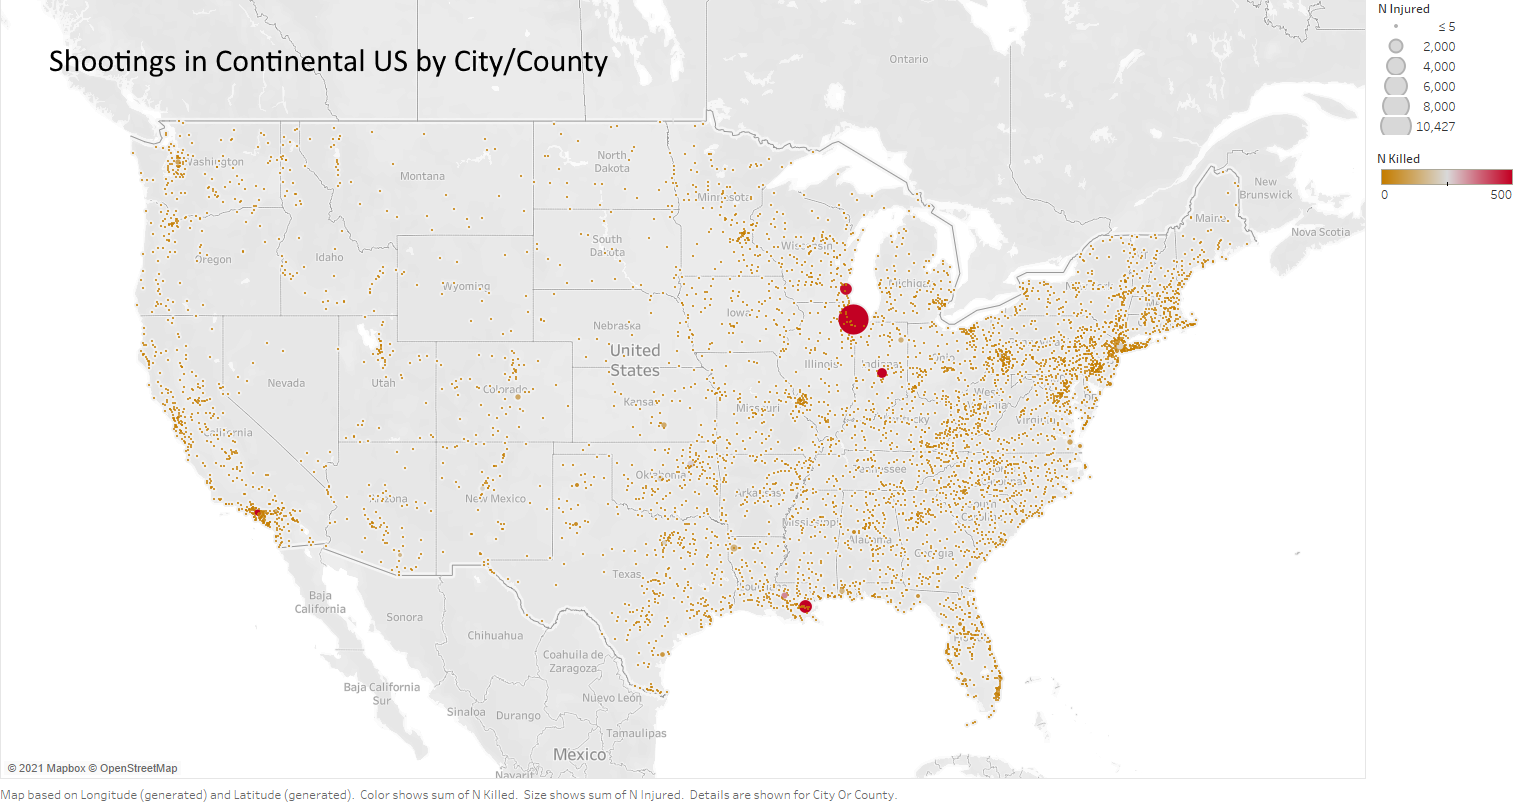
We decided to make a few modifications to the original data set upon use. First, we have decided to exclude from analysis fields that are non-quantifiable (such as source or street address), incomplete (the data set mentions whether guns were stolen or not, but the vast majority of entries were missing this information), or analytically unimportant (for instance, “Incident ID”). Second, we created two novel fields: “Casualties”, which sums the number of individuals killed with the number of individuals injured, and “KillProp”, which indicates the proportion of casualties that were fatalities. Third, we have decided to highlight an important outlier that exists within the data set. The figure below describes the number of fatalities, injuries, guns involved, casualties, and fatality proportion by city or county. Note that Chicago, Illinois, has a significantly larger number of casualties than any other city or county in the United States. This may affect our analysis.
casualties.head()| city_or_county | Killed | Injured | congressional_district | latitude | longitude | GunsInvolved | Casualties | KillProp |
|---|---|---|---|---|---|---|---|---|
| Chicago | 1186 | 5661 | 1 | 41.7286 | -87.6425 | 6660 | 6847 | 0.17321454651672 |
| Saint Louis | 550 | 956 | 1 | 38.6676 | -90.2482 | 1482 | 1506 | 0.36520584329349 |
| Baltimore | 441 | 970 | 7 | 39.3375 | -76.661 | 2478 | 1411 | 0.31254429482636 |
| Philadelphia | 413 | 851 | 2 | 39.9961 | -75.1708 | 1266 | 1264 | 0.32674050632911 |
| Houston | 549 | 669 | 9 | 29.7201 | -95.611 | 1403 | 1218 | 0.45073891625616 |
casualties.describe()| Killed | Injured | congressional_district | latitude | longitude | GunsInvolved | Casualties | KillProp | |
|---|---|---|---|---|---|---|---|---|
| count | 10048 | 10048 | 10048 | 10048 | 10048 | 10048 | 10048 | 7268 |
| mean | 3.10788 | 5.76264 | 7.74293 | 38.1796 | -90.6306 | 17.6495 | 8.87052 | 0.469655 |
| std | 20.6596 | 66.0498 | 8.33782 | 5.47593 | 16.0886 | 107.018 | 84.9438 | 0.395372 |
| min | 0 | 0 | 0 | 19.1127 | -165.711 | 1 | 0 | 0 |
| 25% | 0 | 0 | 2 | 34.3363 | -96.0765 | 1 | 0 | 0 |
| 50% | 1 | 1 | 5 | 38.7669 | -86.117 | 2 | 1 | 0.470588 |
| 75% | 2 | 2 | 10 | 41.6317 | -79.9755 | 7 | 3 | 1 |
| max | 1186 | 5661 | 53 | 71.2997 | -67.2711 | 6660 | 6847 | 1 |
As the “count” entry indicates, our data set includes 10,048 different cities or counties located within the United States. While almost every gun violence incident had casualties, a small but notable number did not. Nevertheless, the vast majority of locales that experienced gun violence did not experience significant gun violence. The median locale, in fact, had 1 casualty between 1/1/2013 and 12/31/2018 , with a relatively even split between injuries and fatalities. Nevertheless, a few high-violence areas skew this data, resulting in a mean casualty value of 8.87, with and a mean of 17.65 (total) guns involved in incidents over this date range. The exceptionally large standard deviation should serve as a testament to the variability in gun violence behavior between cities and counties throughout the United States. Interestingly, the proportion of fatality, on mean, is approximately .5 as well, though this proportion is significantly lower in high-violence areas including Chicago, St. Louis, and Baltimore. Clearly, we disregard “nonsensical” data, such as the “mean congressional district.”
A preliminary examination of our data reveals that a handful of locations (Chicago, St. Louis, Baltimore, Philadelphia, etc…) represent an outsize proportion of gun violence incidents, while most locations that have a single incident fail to see another. If it is the case that gun violence is incredibly clustered, the characterization of shootings as a “national epidemic” may be misleading; perhaps, this is an “ultra-epidemic” confined to a select number of places rather than an epidemic that pervades the nation as a whole.
In economics, the Pareto Principle states, “roughly 80% of consequences come from 20% of causes.” Perhaps a similar idea holds true for gun violence in the United States, with the 20% of locations responsible for most casualties bearing responsibility for a hugely disproportionate incidence of violence. If so, it may be advisable to consider gun violence a “clustered” phenomenon.
More specifically, the question we pose is: In months throughout 2013-2018 with high gun casualties throughout the nation, are an outsize proportion of casualties concentrated in “high-casualty” areas? In other words, do factors that drive up gun violence nationwide over a defined period of time have an especially notable effect on “high-casualty” areas? A resolution to this inquiry may shed light on whether gun violence prevention-related resources should be spread thinly throughout the nation, or allocated in a manner that reflects the clustered nature of gun violence.
As can be seen above, certain areas exhibit significantly higher amounts of gun violence when grouped by city or county. Chicago, as mentioned, is an extreme outlier; other similar clusters include New Orleans, Milwaukee, Indianapolis, and to a lesser extent, Los Angeles. It is with logistic regression that we will try to determine whether these clearly visible clusters are indeed responsible for a statistically significant proportion of the incidents.
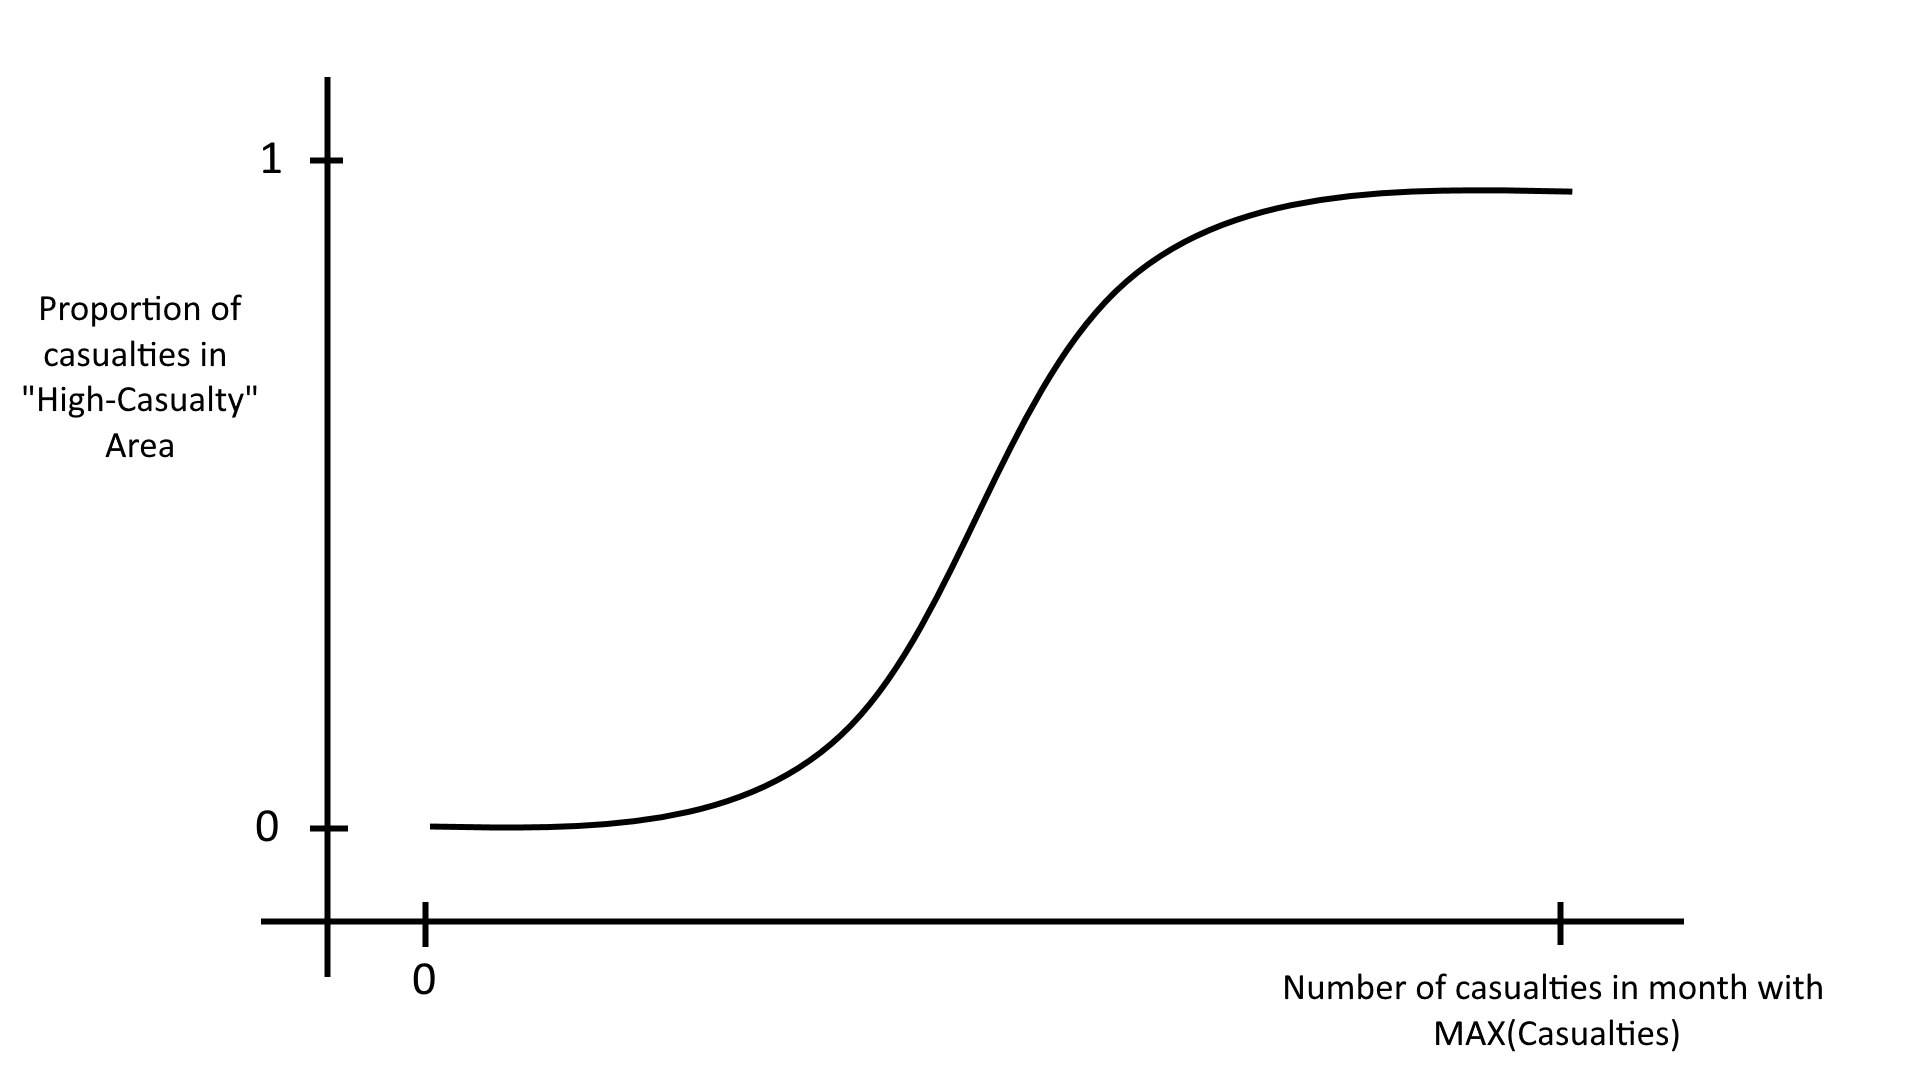
In holding consistent with Pareto Principle, we deem the 20% of locales responsible for the highest gun casualties (2,010 locales) as “high-casualty areas”, and the remaining 80% of locales (8,038 locales) as “low-casualty areas.” Mathematically, we can denote “high-casualty areas” as “1” and “low-casualty areas” as “0”. This will serve as a dependent variable.
In evaluating gun violence month-on-month, we will deem each month’s total gun violence casualties (nationwide) a continuous, numerical independent variable. We plan to perform a logistic regression between these two variables, producing results that resemble the following:
In 2019, the term “Stochastic Terrorism”, in dictionary search3, was trending. The idea refers to violent events that are nearly inevitable, but whose specifics are impossible to predict. While each and every shooting event has its own particular backstory that, perhaps, cannot be forecasted, it may be the case that there are time-linked factors providing clear hints that a given number of gun violence incidents (within a range, of course) will all but definitely occur.
While 2020-2021 displayed an unusual profile of gun crime due to the global COVID-19 pandemic and ensuing lockdowns, examining data over a more “typical” timeframe, such as 2013-2018, may provide insight into two important lines of inquiry:
Has there been a year-on-year trend in gun violence casualties between 2013 and 2018? Will this trend return once we revert to post-pandemic normalcy?
Is there a seasonal trend in gun violence casualties?
Combining these thoughts, our ultimate question will be: given potential trends, can gun violence casualty incidence be forecasted? In order to further resolve this, we plan to create a forecasting model based on observed trends, and compare it to 2019 gun casualty data to assess accuracy.
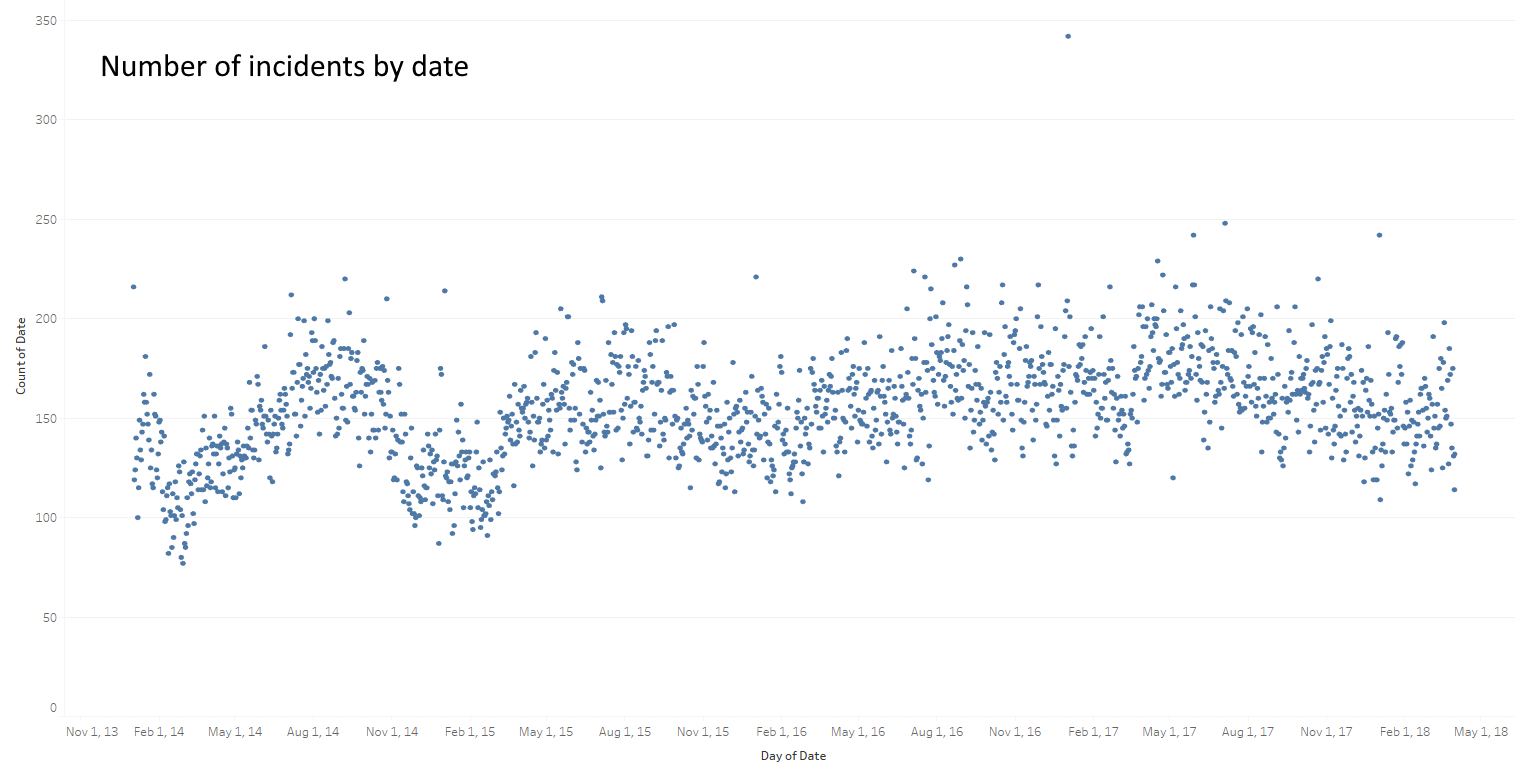
We can clearly see above that there is a seasonal trend in gun violence — there is more gun violence in the summer months, and less in the winter. This visualization implies that it might be possible to forecast the amount of gun violence at a given time of year, which we will attempt to do with the Holt-Winters model.
In order to forecast gun violence casualties, we plan to create a Holt-Winters Forecasting Model that incorporates both month-on-month seasonality and year-on-year trend. Following this, we will be able to test this model on 2019 data to assess predictive accuracy. If we find that this trend and seasonality hold as effective predictors of future gun violence, it would be reasonable to consider the issue somewhat “predictable” in nature. If so, future budget allocations to gun violence prevention, season-dependent policing and regulatory changes, and general community preparedness may be subject to (informed) change.
In 2018, the New York Times reported on a disturbing phenomenon: on “hot” days, shooting rates skyrocketed4. Alarmingly, they found that average yearly temperatures were an adequate predictor of gun violence. This makes intuitive sense; warm weather draws people outside, and more people on the streets leads to more public (or gang-related) confrontation, which, in turn, implies more gun violence.
Does this heat explain the (possible) seasonality demonstrated in the gun casualty visualizations of the previous section, or is seasonality present in the data for other (non-temperature) reasons, such as school recess, seasonal drug market fluctuations, or cultural influences on gun usage?
One way of examining this is to compare seasonality in cold-winter areas, for which northern latitude is an adequate proxy, to seasonality in the American South, where winter and summer temperatures do not differ as substantially. In short, the question we set out to answer is: Is seasonality in gun casualty incidence geographically linked to latitude, or can seasonality in gun casualty incidence not be explained by geography?
Insight into this question may allow policymakers to focus resources on either temperature/weather alone in combating gun violence, or on other non-climate linked factors that could potentially be responsible for seasonality.
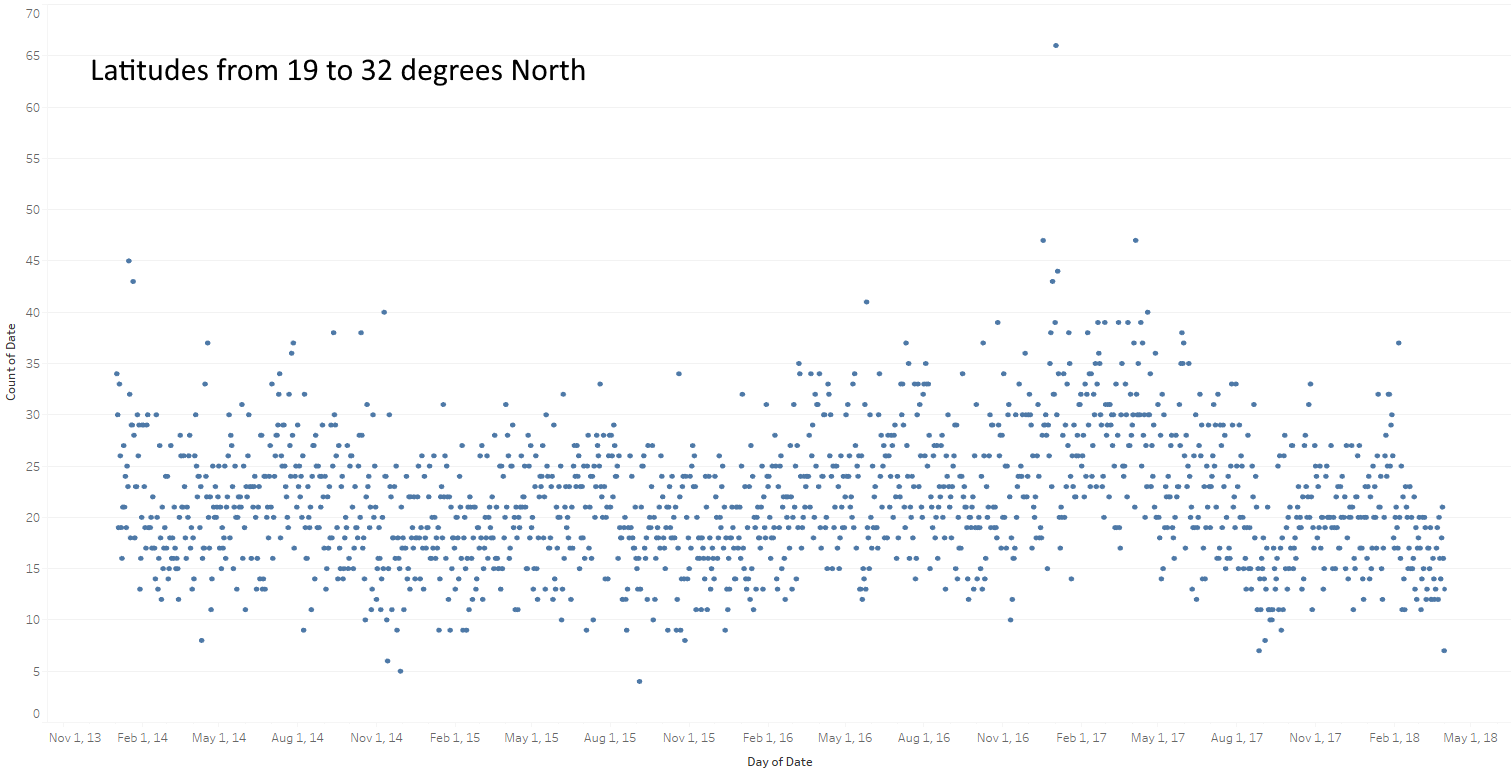
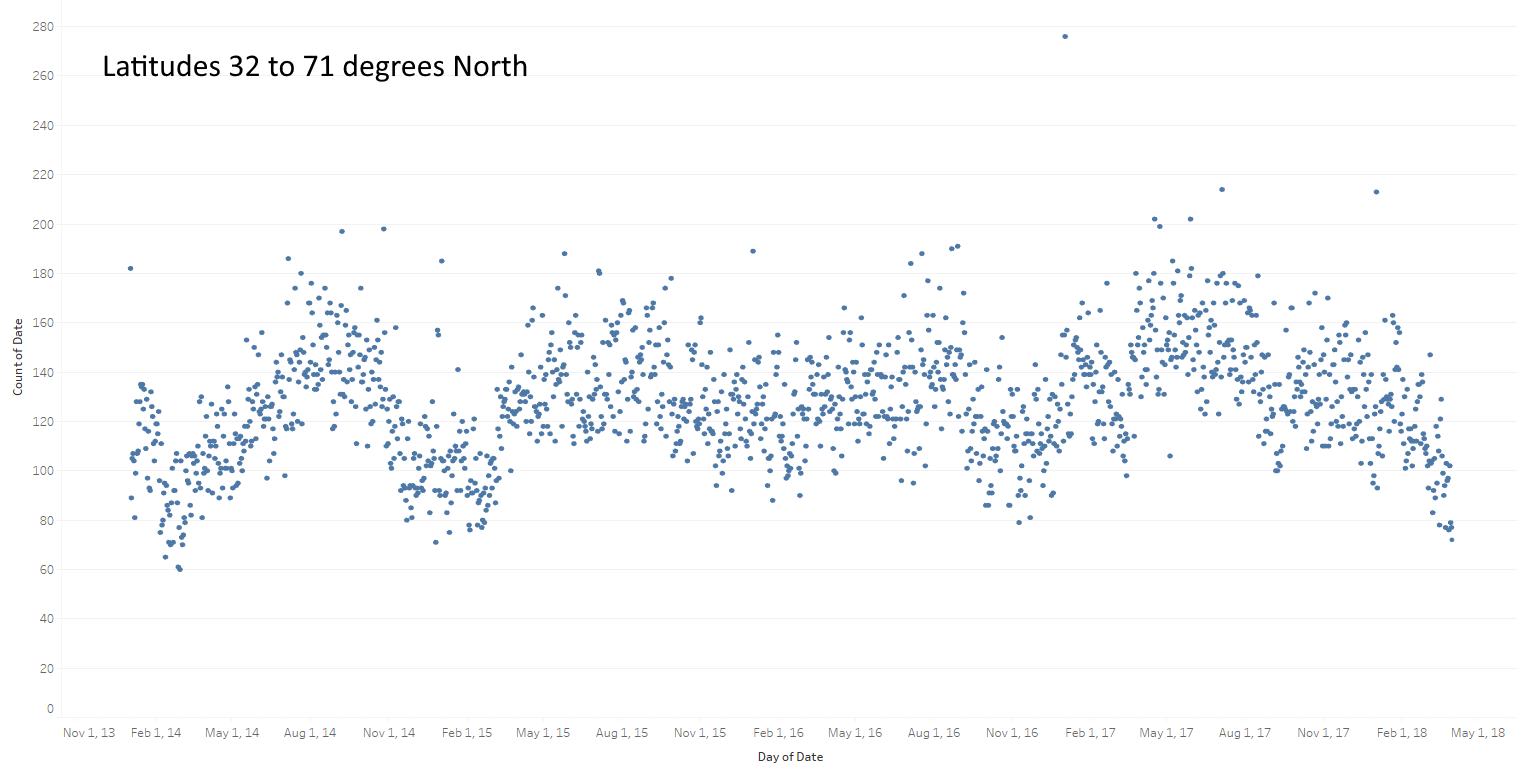
The above plots from Tableau illustrate trends for latitudes under 32 degrees North and latitudes over 32 degrees North. While there doesn’t appear to be a clear trend in gun violence incidents under 32 degrees North in latitude, the number of incidents over that latitude appears to follow a clear sinusoidal trend — moreso, even, than the trend exhibited by the visualization in Question 2. To more accurately characterise this dichotomy, we will appeal to the sinusoidal nature of each of the plots, and attempt to show that there is a significant difference in these two trends — which should key us in on the relationship temperature has with gun violence.
As temperature throughout the year fluctuates sinusoidally (temperature in the United States is typically coldest early and late in the year, and warmest mid-year over the summer), an appropriate regression model for examining the relationship between date (a proxy for temperature) and gun casualties will be sinusoidal. This relationship will be relatively strong if seasonality holds, but quite weak if it does not. We plan to run two separate regressions; one for northern latitudes (above a given threshold), and for southern latitudes (below the given threshold). If seasonality is only present above the latitude threshold, as it appears to be in the visualizations above, we have evidence that gun violence is temperature-linked.
With gun violence’s sporadic nature, it has been difficult for government officials to act effectively on its prevention. With our three models, we hope to answer some of the current questions in the field, and pose some new ones, the answers to which may prove useful in combating gun violence across the country.